
Operating within a Nitrate Vulnerable Zone is not about simply cutting back; it is about eliminating systemic waste and unlocking the full potential of your soil’s existing fertility.
- Nutrient deficiencies are often caused by « lock-up » (e.g., compaction limiting Potassium uptake, high pH immobilizing Phosphorus) rather than a simple lack of minerals in the soil.
- Advanced nutrient sources and biological strategies (like mycorrhizal fungi and legumes) provide pathways to deliver nutrition in sync with crop demand, drastically reducing leaching and waste.
Recommendation: Adopt a ‘precision compliance’ mindset. Treat your soil’s biological and chemical capital as a primary asset to be managed, which will enhance both productivity and regulatory adherence.
For farmers in Nitrate Vulnerable Zones (NVZs), the challenge is a constant balancing act. You follow the rules, manage your application rates, and time your inputs, yet you may still see declining soil indices and persistent nutrient deficiencies in your crops. The standard advice—to conduct more soil tests and apply fertilizers at the « right time »—often feels inadequate. It addresses the symptoms but fails to tackle the root cause of systemic inefficiency that costs both yield and money, all while the risk of non-compliance looms.
This regulatory framework, however, can be viewed not as a limitation, but as a driver for genuine agricultural efficiency. What if the solution wasn’t just about ticking compliance boxes, but about fundamentally rethinking how nutrients behave in your specific soil environment? The key to correcting deficiencies without over-fertilizing lies in shifting focus from ‘how much’ is applied to ‘how much’ is actually available and utilized by the plant. This involves mastering the underlying soil chemistry and biology to unlock a farm’s inherent ‘biological capital’ and correct the hidden inefficiencies that lead to nutrient loss and lock-up.
This guide moves beyond generic recommendations to provide targeted, compliant strategies. We will dissect the common reasons for Potash, Phosphorus, and Sulphur shortfalls and demonstrate precise, evidence-based methods for nitrogen management. By understanding and addressing the specific mechanisms of nutrient loss and immobilization, you can build a more resilient and productive system that thrives within NVZ constraints.
This article provides a detailed breakdown of the most effective strategies for compliant nutrient management. The following summary outlines the key areas we will cover to help you enhance fertility while adhering to NVZ regulations.
Summary: A Guide to Efficient Nutrient Management in NVZs
- Why Your Potash Levels Are Dropping Despite Regular Applications?
- How to Unlock Legacy Phosphorus in Soils with High Calcium?
- Polysulphate vs Ammonium Nitrate: Which Delivers Better Sulphur ROI?
- The Timing Error That Washes Nitrogen into Watercourses in February
- Variable Rate Application: How to Target Low-Index Areas Precisely?
- The Timing Error That Flushes Mineralized Nutrients into Waterways
- Following Legumes: How to Quantify the N-Credit for the Next Wheat Crop?
- How to Fix Atmospheric Nitrogen to Replace Bag Fertilizer on Arable Farms?
Why Your Potash Levels Are Dropping Despite Regular Applications?
A common frustration for compliant farmers is watching potash (K) indices fall even with consistent applications. The issue is often not the amount of K in the soil, but the plant’s inability to access it—a classic case of nutrient lock-up. Soil compaction is a primary culprit. When soil structure is poor, root growth is restricted, and since potassium is immobile in the soil, roots must physically intercept it. If roots cannot explore the soil volume, the plant will show K deficiency symptoms regardless of what soil test results say. This problem is widespread; recent research highlights that globally, around 20% of agricultural soils face severe potassium deficiency, often exacerbated by physical constraints.
Furthermore, dry conditions can severely limit K uptake, as water is the medium for nutrient transport to the root surface. In loose, dry topsoil, the pathway is broken. This creates an « induced deficiency » that is not related to the total K reserves but to its immediate availability.
Case Study: Compaction-Induced Potassium Deficiency
Research from Iowa State University documented that significant potassium deficiency symptoms in corn and soybeans can appear even when soil tests show adequate or high K levels. The study identified that any factor limiting root growth—including compacted soil layers, root pruning from cultivation, excessively dry and loose soil, or seed furrow sidewall compaction—directly restricts the plant’s K uptake. This demonstrated that K deficiency can be induced by poor soil physical condition, creating a bottleneck that fertilizer applications alone cannot solve without addressing the underlying structural issues.
Correcting this requires a two-pronged approach: improving soil structure through practices like reduced tillage, cover cropping, and targeted aeration, alongside ensuring K is applied where active roots can reach it. It’s about enabling the plant to access the nutrients already present.
Your Action Plan: Auditing for Nutrient Lock-Up
- Identify Problem Zones: Use yield maps and visual assessments to pinpoint areas of the field with consistently poor growth, leaf striping, or stunted development, which are classic signs of K deficiency.
- Diagnose Physical Barriers: In these zones, dig a soil pit or use a penetrometer to check for compaction layers at tillage depth or below. Assess root growth patterns—are roots growing vertically or are they forced to grow horizontally along a hardpan?
- Correlate with Soil Tests: Take separate soil samples from both the poor-performing zones and healthy areas. If the K-index is adequate in the problem zone, it strongly indicates a physical or environmental lock-up issue, not a mineral deficit.
- Assess Moisture and Tillage Impact: Evaluate the soil’s moisture-holding capacity in these zones. Note if the deficiency symptoms are worse in dry years or if specific tillage practices (e.g., sidewall compaction at planting) correlate with the problem areas.
- Formulate a Remediation Plan: Based on the diagnosis, prioritize actions. This could be targeted subsoiling to break a pan, introducing deep-rooting cover crops into the rotation, or adjusting planter settings to reduce sidewall smearing.
How to Unlock Legacy Phosphorus in Soils with High Calcium?
In soils with high pH and significant calcium content, a large proportion of applied phosphorus (P) can become rapidly immobilized, or « locked up. » This occurs when soluble phosphate ions react with calcium to form insoluble calcium phosphates, such as apatite. This legacy phosphorus remains in the soil but is unavailable for plant uptake, representing a significant wasted investment and a drag on productivity. Simply applying more phosphate fertilizer often exacerbates the problem, as a large percentage of the new application quickly suffers the same fate. This chemical reality means that fields can have high total P levels but still produce P-deficient crops.
The solution lies not in chemistry alone, but in biology. Mobilizing this legacy P requires activating the soil’s biological capital. The most powerful tool for this is the encouragement of arbuscular mycorrhizal fungi (AMF). These beneficial fungi form a symbiotic relationship with plant roots, creating a vast network of fine hyphae that extends far beyond the root’s reach. This network acts as a highly efficient P acquisition system.
This microscopic network is key to unlocking nutrients that are chemically bound in the soil. The visual below helps conceptualize how these fungal networks interface with the soil matrix to access otherwise unavailable resources.
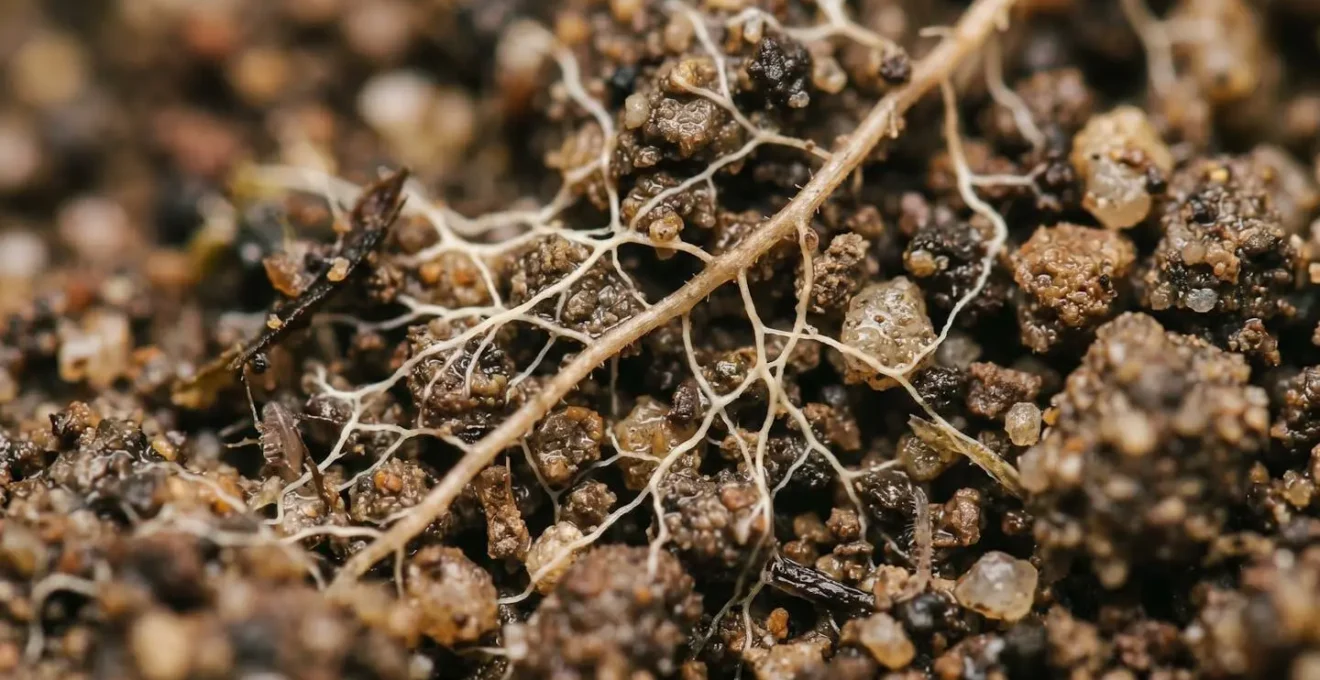
As this image suggests, the fungal hyphae can explore a much larger soil volume and access smaller soil pores than roots can. More importantly, they exude organic acids that create a localized acidic environment around the hyphae, which helps to dissolve insoluble calcium phosphates and release the locked-up P, making it available to the fungus and, in turn, to the plant. Fostering a healthy AMF population through reduced tillage, diverse crop rotations, and the use of cover crops is a direct and sustainable strategy for mining the bank of legacy P in your fields.
Polysulphate vs Ammonium Nitrate: Which Delivers Better Sulphur ROI?
When correcting a sulphur deficiency while managing nitrogen inputs under NVZ rules, the choice of fertilizer is critical. The comparison between Polysulphate and Ammonium Nitrate (AN) isn’t just about the nutrients they contain; it’s about efficiency, environmental footprint, and return on investment (ROI). While AN is a primary nitrogen source, its production is energy-intensive, and it carries a high risk of nitrogen loss through leaching and volatilization. Polysulphate, a natural mineral, offers a multi-nutrient alternative with a significantly lower carbon footprint.
Polysulphate provides a prolonged-release source of four key nutrients: sulphur, potassium, magnesium, and calcium. This gradual release pattern ensures nutrient synchronization—supplying nutrients as the crop’s demand increases, which minimizes the risk of loss to the environment. This is a stark contrast to the rapid, often wasteful release from more soluble sources.
The following table provides a direct comparison of the key factors, based on data regarding Polysulphate’s properties, to help evaluate which product offers a superior ROI within a compliant farming system.
| Factor | Polysulphate | Ammonium Nitrate | Advantage |
|---|---|---|---|
| Carbon Footprint (kg CO₂e per kg product) | ~0.06 | ~1.2 | Polysulphate 20× lower |
| Primary Nutrients | S (48% SO₃), K (14% K₂O), Mg (6% MgO), Ca (17% CaO) | N (35% N) | Polysulphate multi-nutrient |
| Processing Required | Mined, crushed, screened only | Energy-intensive chemical synthesis | Polysulphate natural |
| Release Pattern | Prolonged, synchronized with crop uptake | Rapid, high leaching risk | Polysulphate lower loss |
| Ammonia Volatilization Risk (pH > 7 soils) | None (no NH₃) | High (20-40% N loss as NH₃) | Polysulphate zero emissions |
Case Study: Reducing Nitrogen Rates with Polysulphate
Trials conducted by Agrii’s R&D team demonstrated that incorporating Polysulphate into a fertility program for milling wheat enabled nitrogen rates to be cut by more than a third without compromising yield or grain protein. The multi-nutrient profile of Polysulphate, especially its potassium and sulphur content, improved overall nutrient use efficiency. This allowed growers to reduce their standard ammonium nitrate application from 250 kg N/ha down to approximately 160 kg N/ha while still achieving the necessary quality standards for milling wheat, showcasing a clear improvement in both economic and environmental performance.
The Timing Error That Washes Nitrogen into Watercourses in February
A critical and costly mistake in NVZs is applying nitrogen fertilizer based on the calendar rather than on field and crop conditions. The classic error is the early February application, often justified as « getting a head start. » However, if soils are cold (below 5-7°C) and saturated, and the crop is not in a state of active growth, this applied nitrogen has nowhere to go but down. With winter rainfall patterns, it is rapidly leached out of the root zone and into watercourses, representing a total financial loss and a significant environmental breach. This timing issue is a major contributor to nutrient pollution, and studies have shown its significant impact within crop rotations.
For instance, research from a corn-soybean-wheat rotation study found that the vast majority of nitrate loss can occur in the period between harvest and the establishment of the next crop, when there are no active roots to capture available nitrogen. Applying fertilizer into this « leaky » system is the definition of inefficiency. Precision compliance demands a shift from a calendar-based to a condition-based application strategy. This means waiting for clear signals that the crop is ready to utilize the nutrients immediately.
The key is to apply nitrogen only when the plant is actively growing and can intercept it. Adopting a flexible, data-driven approach is essential for maximizing nutrient use efficiency and staying compliant. The following framework outlines the critical checks to perform before any early-season nitrogen application.
- Monitor soil temperature continuously: Apply first nitrogen only when soil reaches sustained temperatures above 5-7°C and crop growth is entering an exponential phase, not based on calendar date alone.
- Integrate 7-10 day weather forecasts: Check rainfall predictions before each application; postpone if significant precipitation (>20mm) is forecast within 48-72 hours of planned application.
- Assess soil moisture status pre-application: Use soil sensors or visual assessment to ensure soil is not already at saturation; delay if field capacity is exceeded in the top 30cm.
- Track crop growth stage indicators: Use NDVI monitoring or visual growth stage assessment to match nitrogen supply with rapid uptake periods (e.g., GS21-32 for cereals).
- Consider enhanced efficiency fertilizers for early applications: Apply urease or nitrification inhibitors when timing is constrained by operational windows but weather risk is elevated.
Variable Rate Application: How to Target Low-Index Areas Precisely?
Variable Rate Application (VRA) is a cornerstone of precision compliance, allowing you to apply nutrients exactly where they are needed and at the rate they are needed. This moves beyond blanket applications that over-fertilize productive areas and under-fertilize deficient ones. However, effective VRA is more complex than simply using a single year’s yield map. To truly target low-index areas with precision, you must build management zones based on a multi-layered data approach that reveals the underlying causes of yield variation.
A single yield map shows what happened, but not why. A low-yielding area could be suffering from a nutrient deficiency, but it could equally be caused by compaction, poor drainage, or a different soil type with lower water-holding capacity. Applying a high rate of fertilizer to an area with a non-nutrient-related limitation is wasteful. A robust VRA strategy integrates multiple data streams to create zones based on consistent performance potential and the specific factors limiting that potential.
This involves layering data from various sources to build a comprehensive picture of field variability. Only then can you create accurate prescription maps that address the specific needs of each zone, ensuring every kilogram of fertilizer is a sound investment. The following framework details the essential data layers for creating intelligent and effective management zones.
- Collect baseline yield maps: Compile a minimum of 3 years of calibrated yield monitor data, normalized for seasonal variation, to identify consistently high- and low-performing zones.
- Layer satellite NDVI/NDRE imagery: Integrate multi-season vegetation indices at key growth stages to reveal patterns of nutrient stress that may not be visible in yield maps alone.
- Conduct soil conductivity (EC) mapping: Perform electromagnetic scans to map variations in soil texture, organic matter, and moisture-holding capacity, which directly affect nutrient availability.
- Incorporate elevation and flow accumulation data: Use LiDAR-derived terrain analysis to identify zones prone to nutrient leaching (slopes, sandy ridges) or accumulation (depressions).
- Create profit-potential zones, not just nutrient zones: Weight all data layers by the economic returns per zone over time; some chronically low-index areas may warrant only maintenance rates rather than intensive correction if the yield potential is inherently low.
- Implement a ground-truthing feedback loop: Take georeferenced soil and tissue samples from within each zone (post-VRA) to validate the zone delineation and confirm that the application was effective, allowing for refinement in subsequent seasons.
The Timing Error That Flushes Mineralized Nutrients into Waterways
Another significant timing error, distinct from early spring applications, occurs in the autumn. After harvest, when soils are still warm and moist, microbial activity continues at pace. These microbes break down crop residues and soil organic matter, a process called mineralization. This process releases a substantial flush of plant-available nutrients, particularly nitrate. If the ground is left bare, there are no active roots to capture this valuable nitrogen. When autumn and winter rains arrive, this pool of soluble nitrate is easily leached from the soil profile and lost into groundwater and rivers—a major source of diffuse pollution in NVZs.
This represents a huge loss of a farm’s natural fertility. The key to preventing this systemic inefficiency is to ensure there is always a living root system in the ground to act as a « biological sponge. » This is the primary role of cover crops in an NVZ context. They are not just for improving soil structure; they are an active nutrient management tool.
By capturing and storing this mineralized nitrogen in their biomass over the winter, cover crops effectively « bank » it. When the cover crop is terminated in the spring, this nitrogen is then released back into the soil as the biomass decomposes, becoming available for the following cash crop. This strategy turns a major environmental risk and financial loss into a source of free, recycled fertilizer.
Case Study: Cover Crops as Biological Nutrient Sponges
Research from the University of Wisconsin has demonstrated the critical role of cover crops in the autumn mineralization window. The study showed that after the harvest of an annual crop, soil often remains warm enough for microbes to produce significant amounts of nitrate from organic matter. Without living roots, infiltrating water from rainfall or snowmelt efficiently removes this mineralized nitrate from the root zone. The research found that cover crops chosen for rapid autumn establishment, such as cereal rye or wheat, act as highly effective biological sponges. They capture this soluble nitrate and convert it into stable organic nitrogen within their plant tissues, preventing it from leaching. The study established a direct correlation between the amount of cover crop biomass accumulated in the autumn and the reduction in nitrate leaching, proving their value as a nutrient conservation tool.
Following Legumes: How to Quantify the N-Credit for the Next Wheat Crop?
Integrating legumes into a rotation is a powerful way to build fertility and reduce reliance on synthetic nitrogen. However, to be truly efficient and compliant, the nitrogen (N) credit supplied by the terminated legume must be accurately quantified. Guesswork often leads to either under-application, which hurts yield, or over-application, which wastes money and breaches NVZ limits. The amount of N supplied depends on several factors: the legume species, the total biomass produced, the C:N ratio of the material, and the method and timing of termination. A robust framework is needed to move from a vague « N-credit » to a reliable, field-specific figure.
A high-biomass legume like hairy vetch can supply a very different amount of nitrogen compared to a lower-biomass clover, and the speed of that nitrogen release is heavily influenced by how it is incorporated. Ploughing in a legume leads to a rapid release of N, while leaving it on the surface as a mulch results in a slower, more gradual supply. To optimize the following wheat crop’s nutrition, you need a system to measure and model this contribution accurately.
This involves a combination of field sampling before termination and strategic use of in-season monitoring. By taking a more scientific approach, you can confidently reduce synthetic N applications, knowing that the biological system is providing a measured and predictable portion of the crop’s requirements. The following steps provide a practical framework for quantifying this valuable asset.
- Conduct pre-termination biomass sampling: Before destroying the legume cover crop, collect representative samples from 1m² quadrats. Dry and weigh these samples to establish the total dry matter biomass per hectare.
- Apply crop-specific nitrogen content multipliers: Use standard N content values (e.g., hairy vetch at 3.5% N of dry matter, field pea at 3.0%) or, for greater accuracy, send dried samples to a lab for analysis to calculate the total N held in the biomass.
- Establish zero-N control strips: At wheat planting, leave several strips across the field with no applied nitrogen fertilizer. Comparing the growth and final yield of these strips to the rest of the field provides an empirical measure of the legume’s actual N contribution in your specific conditions.
- Account for termination method and timing: Model the N release curve based on your termination method. Legumes ploughed in typically release 60-70% of their N in the first 6-8 weeks, whereas surface-mulched or crimped biomass may release 40-50% in the same period with a more extended release into the season.
- Deploy in-season remote sensing verification: Use drone or satellite NDVI imagery at key growth stages (e.g., tillering, stem extension) to compare the vegetation indices in the zero-N strips to standard program areas. This allows you to verify if the N-credit is performing as expected and make informed adjustments to any planned top-dress applications.
Key Takeaways
- Nutrient availability depends more on what the plant can access (soil structure, biology) than the total amount in the soil.
- In an NVZ, the timing of application and the form of the nutrient are more critical for efficiency and compliance than the total volume applied.
- Leveraging biological processes—through cover crops, legumes, and soil health practices—is the most effective strategy for both profitability and environmental stewardship.
How to Fix Atmospheric Nitrogen to Replace Bag Fertilizer on Arable Farms?
The ultimate goal of a truly efficient and resilient farming system within an NVZ is to move beyond simply managing synthetic inputs and towards generating its own fertility. Fixing atmospheric nitrogen through biological processes is the most sustainable way to achieve this, fundamentally reducing the reliance on bag fertilizer. This is not about a single-season fix but about a strategic, multi-year rotation design that systematically builds soil organic nitrogen—a stable, slow-release form of fertility that is far less prone to leaching than synthetic alternatives.
This approach treats the entire farm rotation as a single, integrated system for fertility building. It involves alternating high-demand cash crops with dedicated fertility-building phases using deep-rooting legumes and diverse cover crop mixes. Each phase of the rotation has a specific job: one year might be focused on fixing large amounts of atmospheric N and breaking compaction, while the next is designed to cash in on that stored fertility with a high-value crop requiring minimal synthetic input. The following year might then focus on scavenging residual nutrients and adding diverse organic matter to feed soil biology.
This strategy represents the pinnacle of managing biological capital. It requires long-term planning but pays dividends in reduced input costs, improved soil health, and enhanced resilience to both weather extremes and regulatory pressures. A well-designed fertility-building rotation can significantly reduce synthetic N requirements over the cycle, often by 40-60% or more compared to a conventional system.
The following five-year framework illustrates how such a rotation can be structured to systematically build fertility and reduce dependency on external inputs.
- Year 1 – Deep-rooting legume establishment: Plant a two-year ley of red clover, lucerne, or sainfoin to fix 150-250 kg N/ha while building soil organic matter and breaking compaction with deep taproots.
- Year 2 – High-demand cash crop utilizing legume N: Follow the terminated legume with a high-demand crop like wheat or maize, applying only 50-70% of the standard N rate to capitalize on the mineralized nitrogen.
- Year 3 – Scavenging crop with diverse cover: Plant a spring cereal or oilseed, immediately undersowing it with a multi-species cover crop mix (e.g., vetch, phacelia, radish) to capture residual and mineralized N through the autumn and winter.
- Year 4 – Biological diversity and soil structure year: Implement a green manure or a low-input forage crop that focuses on adding biomass and feeding soil biology without significant nutrient extraction. Terminate before seed set to prevent nutrient tie-up.
- Year 5 – Return to intensive cash crop with minimal inputs: The soil organic nitrogen accumulated over the previous four years will mineralize to support a high-value crop (e.g., milling wheat, malting barley) with synthetic N requirements reduced by 40-60% versus a conventional continuous arable system.
To move from reactive correction to proactive nutrient management, begin by auditing one field for the inefficiencies discussed here. This focused approach will provide the data and confidence needed to scale these principles across your entire operation, ensuring a future that is both productive and compliant.