Verifiable biodiversity data is no longer a ‘nice-to-have’; it’s a quantifiable financial asset for the modern farm.
- Systematic butterfly and moth monitoring provides the hard evidence of ethical stewardship required by new environmental schemes.
- Targeted habitat management for specific indicator species directly boosts the metrics that validate ecological improvement.
Recommendation: Implement a weekly transect walk following a standardised methodology to start building your farm’s unique and defensible biodiversity baseline.
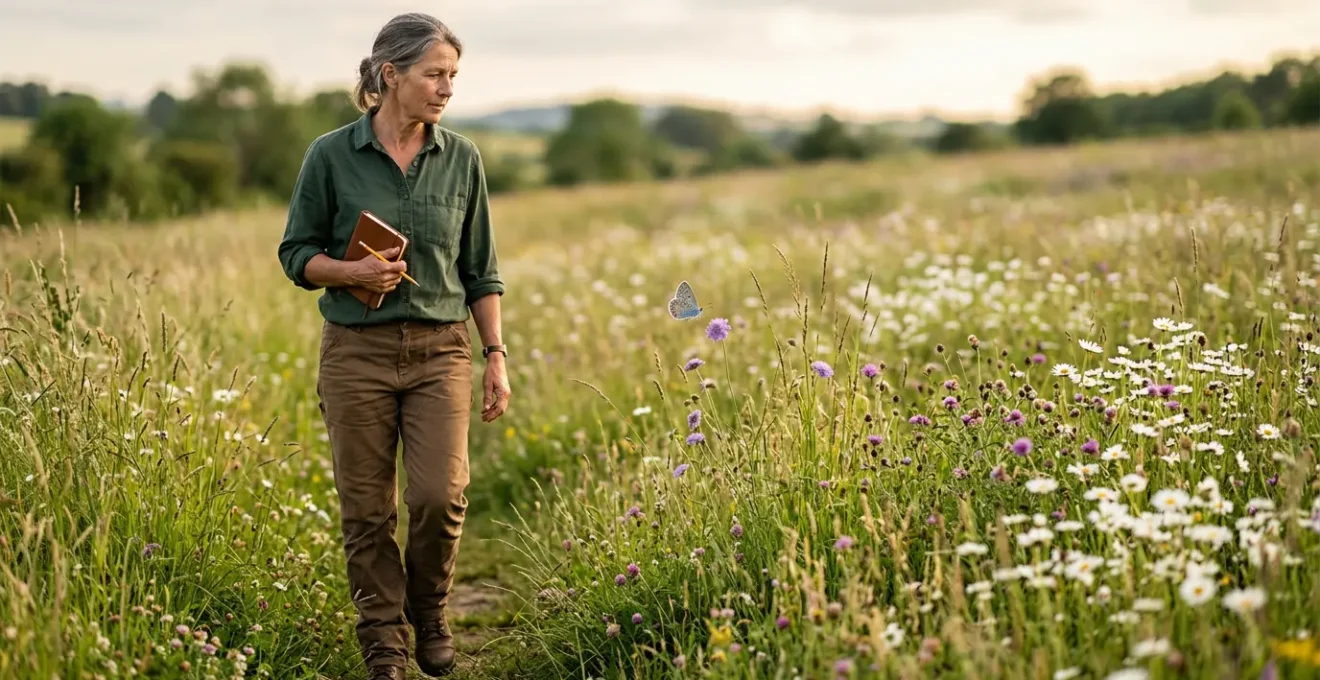
For farmers and landowners, the call to enhance biodiversity is growing louder. Yet, good intentions are no longer enough. The new era of environmental stewardship demands proof. How can you demonstrably show that your management practices are yielding real, positive ecological change? While many focus on general wildflower planting, they often miss the crucial next step: measurement. The ability to validate your efforts with data is what separates hopeful habitat creation from a verifiable, and often profitable, environmental asset.
The key lies not just in attracting more insects, but in understanding which ones tell the most important story. Native Lepidoptera—butterflies and moths—are exceptional bio-indicators. Their sensitivity to environmental change, specific food plant requirements, and relatively simple monitoring protocols make them the perfect tool for generating this proof. But simply counting butterflies on a sunny afternoon is not enough to satisfy the rigorous demands of grant applications or certification bodies.
This guide moves beyond the basics. We will explore a more robust, data-driven approach. Instead of just attracting butterflies, you will learn how to turn their presence into a scientifically valid metric of your farm’s health. This is about transforming your observations into a powerful narrative of regeneration, backed by credible evidence. We will delve into specific indicator species, the precise management techniques that support them, and the standardised monitoring protocols that make your data count.
This article provides a detailed roadmap for turning your farm’s insect life into a credible testament to your stewardship. We will cover key indicator species, precise habitat management, standardised counting methods, and how to leverage this data for financial benefit.
Summary: A Farmer’s Field Guide to Monitoring Lepidoptera as Bio-indicators
- Why the Meadow Brown is a Reliable Indicator of Grassland Health?
- How to Manage Nettles to Support Peacock and Red Admiral Caterpillars?
- Scrub vs Short Grass: Which Hosts More Rare Moth Species?
- The Flail Hedge Cutting Mistake That Wipes Out Brown Hairstreak Eggs
- When to Count: Establishing a Transect Walk Routine for Valid Data
- Why the ‘Tea Bag Index’ is a Reliable Test for Microbial Activity?
- How to Tell Your Farm’s Stewardship Story on Social Media?
- How to leverage Ethical Stewardship to Command a Premium Price for UK Produce?
Why the Meadow Brown is a Reliable Indicator of Grassland Health?
To build a credible biodiversity baseline, you need to start with a species that is both common and informative. The Meadow Brown (Maniola jurtina) is a perfect candidate. As a generalist, its population is less volatile than those of specialist species, which can fluctuate dramatically. This stability makes the Meadow Brown an excellent ‘control’ species. A steady or increasing population on your farm, when specialists might be struggling regionally, provides a strong indicator that your foundational grassland habitat is healthy and well-managed.
The caterpillars feed on a variety of common grasses like bents, fescues, and meadow-grasses, which are the backbone of permanent pasture and hay meadows. Therefore, a thriving Meadow Brown population directly reflects the condition and extent of these core habitats. Unlike specialist species that require rare flora, the Meadow Brown tells a story about the overall health of your most widespread asset: your grass. While research on grassland butterfly indicators shows that generalists are less affected by overall decline, their consistent presence is a sign of a stable ecosystem capable of supporting a wide food web.
For accurate monitoring, correct identification is paramount. As The Wildlife Trusts note, its appearance is distinct. You can identify the Meadow Brown by its unique combination of features.
The combination of its relatively large size, orange patches on the forewings only, one eyespot on the forewing and none at all on the hindwings, is unique to the meadow brown.
– The Wildlife Trusts, Meadow Brown Species Profile
Tracking the abundance of this species from year to year provides a robust, low-cost metric for your grassland’s ecological function. It’s the first and most accessible data point in your farm’s biodiversity story, demonstrating that your land management supports a healthy, functioning ecosystem from the ground up.
How to Manage Nettles to Support Peacock and Red Admiral Caterpillars?
While often seen as a weed to be cleared, the common stinging nettle (Urtica dioica) is an ecological powerhouse and a critical food source for the caterpillars of several charismatic butterflies, including the Peacock and Red Admiral. However, simply letting nettles grow is not the most effective strategy. Strategic management is key to maximising their value as a habitat resource and turning them into a visible sign of successful stewardship.
The goal is to provide a continuous supply of nutritious, young nettle growth in locations that favour caterpillar development. Caterpillars require warmth for digestion and growth, making sunny, sheltered locations ideal. At the same time, some shaded patches can provide refuge during extreme heat. A monoculture of old, woody nettles is far less valuable than a mosaic of managed patches. By implementing a rotational system, you engineer a habitat that actively produces a bumper crop of butterflies, a highly visible and photogenic result of your conservation efforts.
This isn’t about letting weeds take over; it’s about targeted ecological engineering. A few well-placed and managed nettle beds can become vibrant butterfly nurseries, providing tangible proof of your farm’s commitment to supporting the full life cycle of native species.
Action Plan: Strategic Nettle Patch Management
- Location Diversity: Create multiple nettle patches in both full sun (for caterpillar thermoregulation) and partial shade locations across the farm to provide a range of microclimates.
- Rotational Cutting: Implement a rotational cutting system where only one-third of your total nettle area is cut each year, ensuring a constant supply of nutritious young growth on a three-year cycle.
- Containment: Plant or encourage nettles in specific corners bordered by a frequently mown path. This contains their invasive spread while concentrating their wildlife benefits into a manageable zone.
- Timing is Everything: Time any cutting to avoid peak caterpillar feeding periods. The ideal time is late autumn or winter, well after Peacock and Red Admiral larvae (late spring to mid-summer) have completed their development.
- Leave the Margins: Always leave uncut margins of grass and other vegetation alongside nettle patches to provide essential shelter for adult butterflies and natural predators of aphids.
By adopting this structured approach, you transform a common « problem » plant into a measurable tool for biodiversity enhancement, creating a compelling story of active, intelligent habitat creation.
Scrub vs Short Grass: Which Hosts More Rare Moth Species?
The debate between maintaining open, short-sward grassland and allowing scrub to develop is a common one in farm conservation. While tidy, uniform fields may appeal aesthetically, a mosaic landscape that incorporates scrub is significantly more valuable for biodiversity, particularly for many less-common moth species. The most productive areas are not the scrub itself, nor the open grass, but the transitional zone between them, known as an ecotone.
This graded edge from short grass to taller herbs, then scattered shrubs (like hawthorn, blackthorn, and bramble), and finally denser scrub, creates a huge diversity of microhabitats. It offers varied temperature gradients, shelter from wind, and a succession of flowering plants and larval food sources throughout the season. Many moth caterpillars are specialists, feeding on the woody plants found in scrub, while the adults may nectar on flowers in the adjacent grassland. A sharp, hard edge between habitats is an ecological desert compared to a soft, gradual transition.
This image illustrates the rich structural diversity of an ecotone, the vital transitional habitat between grassland and scrub.
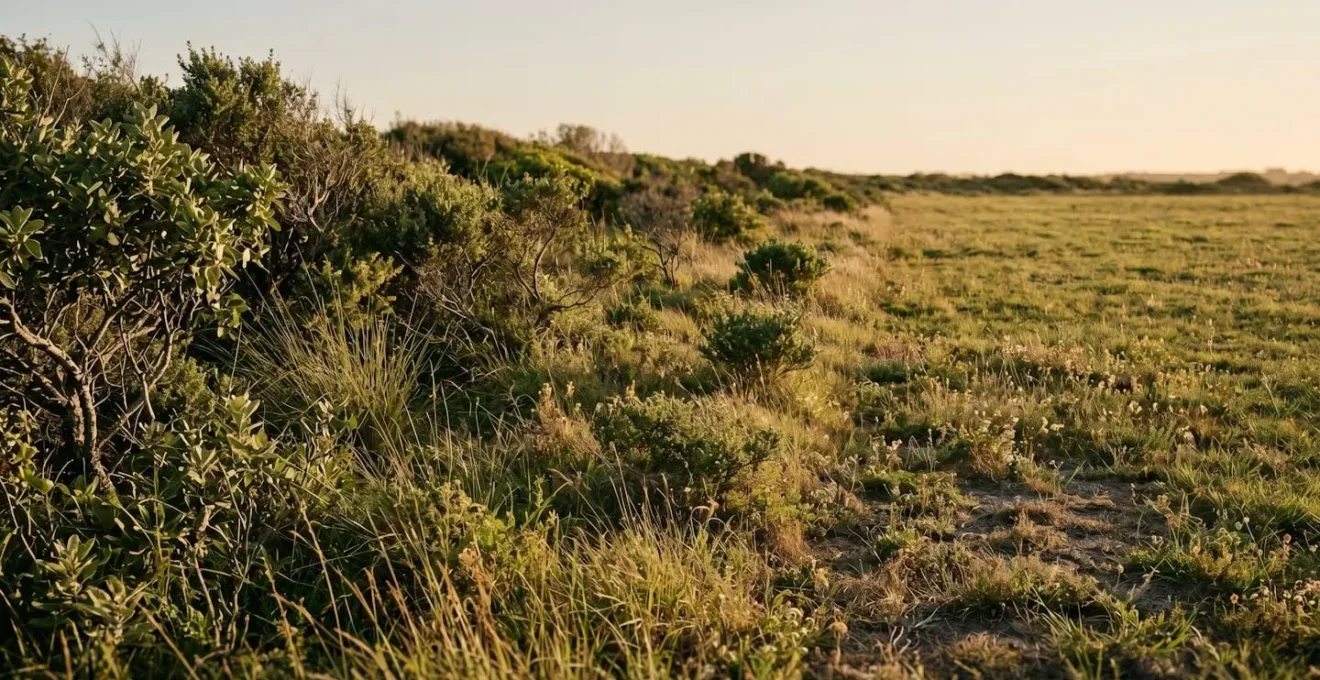
As you can see, this mosaic provides a complex structure offering varied light levels, temperatures, and food sources that a uniform habitat lacks. Encouraging this ‘messiness’ is a powerful strategy for boosting species richness. The ongoing colonisation of the UK by new moth species highlights the dynamic nature of these habitats; providing the right structural complexity gives your farm the best chance of hosting and retaining this incoming biodiversity.
Therefore, the answer is not ‘scrub or grass’, but ‘scrub and grass’. By managing for a diverse structural mosaic with extensive, gradual edges, you create the optimal conditions to support a wider, and often rarer, assemblage of Lepidoptera, making your farm a more resilient and valuable ecosystem.
The Flail Hedge Cutting Mistake That Wipes Out Brown Hairstreak Eggs
Hedgerows are a cornerstone of farm biodiversity, but their value can be nullified by a single, common management error: annual flailing. This practice is particularly devastating for species like the Brown Hairstreak (Thecla betulae), a cryptic butterfly that lays its tiny, white eggs on the young growth of Blackthorn, its sole larval food plant. The timing and frequency of hedge cutting can mean the difference between a thriving colony and its local extinction.
The Brown Hairstreak has become a potent symbol of the impact of intensive hedgerow management. As noted by Butterfly Conservation, the species is in serious trouble precisely because its life cycle is incompatible with aggressive trimming. They state, « The eggs are laid on the young growth of Blackthorn and are very susceptible to annual cutting by tractor mounted flails. » This vulnerability is the reason why conservation data reveals that the Brown Hairstreak’s range has contracted by over 60%, a decline directly linked to hedge loss and the shift towards yearly flailing.
The solution is not to stop cutting hedges, but to adopt a more sympathetic, rotational approach. This allows sections of the hedge to produce the young, succulent growth that egg-laying females prefer, while other sections are left uncut to protect the eggs laid in previous years.
Case Study: Evidence for Rotational Hedgerow Cutting
A 2017 field experiment provided clear evidence for the best way to manage hedges for Brown Hairstreaks. The study demonstrated that hedges cut on a 3-year rotation had significantly more eggs compared to annually flailed hedges. Crucially, it also showed that cutting in late winter (January-February) was far less damaging than autumn flailing, as it avoided the main egg-laying period. The conclusion was a clear management protocol: cutting only one-third of your Blackthorn-rich hedgerows each year on rotation ensures you provide a continuous supply of the young growth females need, while simultaneously protecting the majority of eggs already present on the older growth.
Finding Brown Hairstreak eggs on your farm’s Blackthorn in winter is one of the most powerful pieces of evidence you can gather. It is definitive proof that your management practices are directly supporting a nationally declining specialist species, a fact that speaks volumes to certification bodies and the public.
When to Count: Establishing a Transect Walk Routine for Valid Data
Once you have the right habitats in place, the next step is to gather data in a way that is robust, repeatable, and comparable. This is where the transect walk comes in. It is the gold standard for butterfly monitoring, used by national schemes like the UK Butterfly Monitoring Scheme (UKBMS). A transect is simply a fixed route across your farm that you walk on a regular basis, counting the butterflies you see within a defined area. The key to generating valid data is consistency: walking the same route, at the same pace, under similar weather conditions.
This methodical approach elevates your observations from casual sightings to a structured survey. By recording data weekly throughout the flight season, you build up a detailed picture of which species are present, their relative abundance, and their ‘phenology’—the timing of their emergence and flight periods. This year-on-year data is incredibly powerful. It allows you to spot trends, measure the impact of your habitat management (e.g., did that new wildflower margin boost Common Blue numbers?), and contribute to a much larger scientific picture.
The scale and power of this citizen science effort are immense; data shows that in 2023 over 3,300 sites were monitored by volunteers contributing around 120,000 hours. By adopting the same methodology, you are not just counting butterflies; you are generating a dataset that is compatible with this national-level science, giving your findings immense credibility.
To ensure your data is valid and comparable to these national standards, you must adhere to a strict set of conditions for recording. The UKBMS provides clear guidance:
- Weather Conditions: Only count when the temperature is above 13°C and you have at least 60% sunshine. If the temperature is above 17°C, you can count in any level of sunshine. Avoid high winds.
- Time of Day: Conduct your walks only between 10:45 AM and 3:45 PM. This is the peak activity window for most butterflies and ensures comparability between counts.
- Counting Area: Walk at a slow, steady pace, counting all butterflies seen within an imaginary 5-metre box (2.5m either side of you, 5m ahead, and 5m high).
- Frequency: For the most robust data, record weekly for the 26 weeks from April 1st to September 29th. This captures the full flight season for the majority of UK species.
Establishing this routine is the single most important step in turning your farm into a credible biodiversity monitoring station. It’s a commitment, but one that yields invaluable, defensible data on the health of your land.
Why the ‘Tea Bag Index’ is a Reliable Test for Microbial Activity?
Biodiversity isn’t just about what you can see above the ground; it’s critically dependent on the teeming life within the soil. A healthy soil microbial community is the engine of nutrient cycling and the foundation of a resilient farm ecosystem. But how do you measure this invisible world? The ‘Tea Bag Index’ (TBI) offers an ingenious, low-cost, and scientifically standardised method to do just that.
The principle is simple. Two different types of teabag—one green tea (which decomposes quickly) and one rooibos (which decomposes slowly)—are weighed and then buried in the soil at a standard depth. After about 90 days, they are dug up, dried, and weighed again. The weight loss reveals two key metrics: the decomposition rate (k), which shows how fast organic matter is being broken down, and the stabilization factor (S), which indicates how much material is being incorporated into the stable soil organic matter. It’s a direct measure of your soil’s biological activity.
This close-up shows the two types of standardised tea bags being buried, initiating the 90-day test of soil decomposition activity.
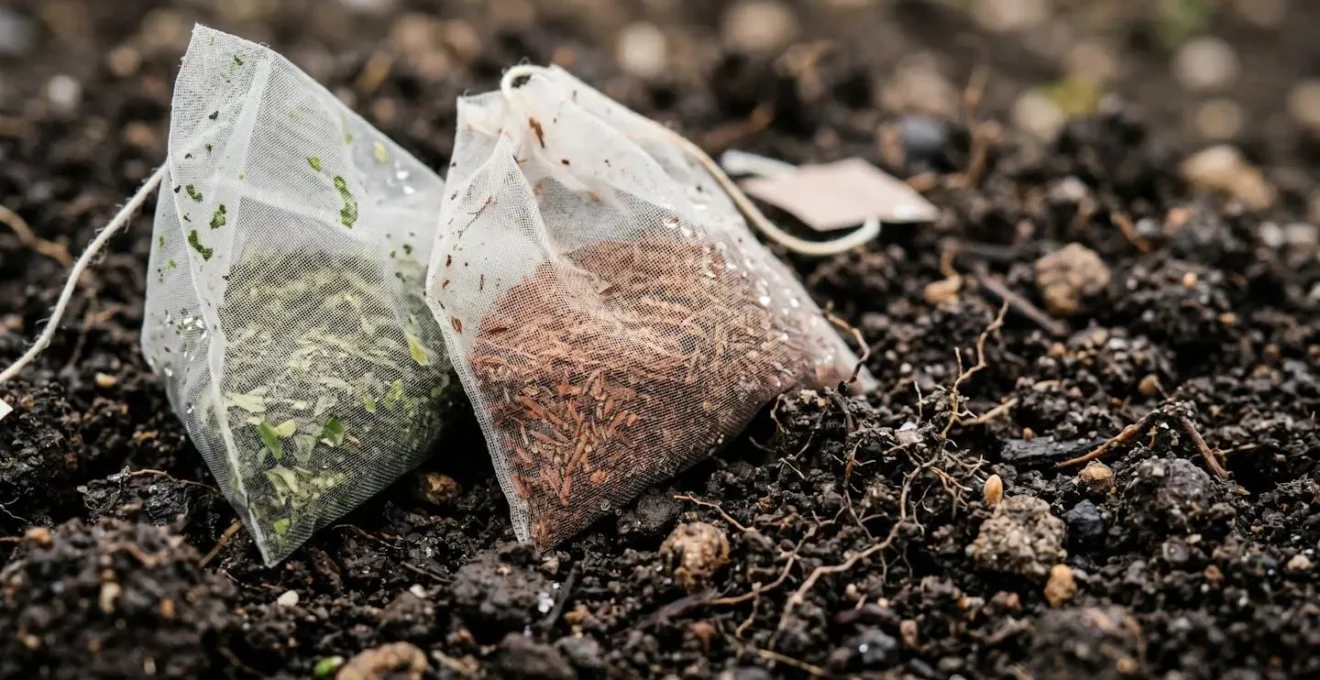
The genius of the TBI is its standardisation. Because the same types of tea bags are used by researchers all over the world, your results are directly comparable to a global dataset. This allows you to benchmark your farm’s soil health against different management systems and environments, providing a powerful, evidence-based narrative about the impact of your practices, such as reduced tillage or cover cropping.
Case Study: TBI Validation in Long-Term Farm Experiments
The reliability of the Tea Bag Index is not just theoretical. A major 2024 study validated the TBI protocol across 29 long-term agricultural sites in Europe. The experiments, running for an average of 38 years, proved that the TBI was sensitive enough to detect clear differences in soil decomposition rates resulting from different farm management practices. The standardised method—burying the bags at 8cm for 90 days—provided directly comparable results that robustly reflected the local soil and climatic conditions, confirming its status as a reliable tool for on-farm soil health assessment.
By incorporating the TBI into your monitoring, you are expanding your biodiversity story from the insects in the air to the microbes in the soil. It provides another layer of hard data, demonstrating a holistic approach to ecosystem regeneration that is both scientifically credible and easy to communicate.
How to Tell Your Farm’s Stewardship Story on Social Media?
Collecting robust biodiversity data is only half the battle; the other half is communicating it effectively. Social media provides a powerful platform to share your stewardship journey, build a connection with your customers, and provide transparent evidence of your environmental credentials. The key to success is to move beyond generic « we love nature » posts and instead tell a compelling, data-driven narrative.
Your monitoring data—transect counts, species lists, photos of rare eggs, TBI results—is your raw material. The goal is to translate these numbers and observations into stories that are relatable, tangible, and authentic. Show the process, not just the results. A picture of you on a transect walk on a grey day, clipboard in hand, can be more powerful than a perfect butterfly photo, as it demonstrates commitment and rigour. This authenticity builds trust and allows your audience to feel part of your farm’s ecological restoration.
The most effective stories are specific. Instead of saying « we have more butterflies, » create a narrative arc around a single species. Document your efforts to manage a hedge for the Brown Hairstreak, from the winter cut to the first egg search, and finally, the sighting of an adult butterfly. This turns an abstract concept like ‘biodiversity gain’ into a gripping, seasonal drama that your audience can follow and invest in. Here are some proven approaches to structure your storytelling:
- Show the Process: Post photos and videos of the monitoring work itself. This includes transect walks, moth trapping sessions, winter egg hunts, or burying tea bags. This demonstrates your commitment and expertise, building credibility.
- Data-Viz a-Simple-Data-Infographic: Turn your raw numbers into a simple, compelling graphic. For example: « A 200% increase in Marbled Whites since creating our wildflower meadow in 2022! » This makes your progress tangible and easy to understand.
- Build a Species Narrative: Focus on a target species for a season. Create a « Marbled White Mission » or « Red Admiral Report » with sequential posts documenting habitat creation, first sightings, and evidence of breeding.
- Before and After: Use visual evidence to make progress undeniable. A photo of a bare field margin from two years ago next to a photo of it buzzing with insects today, accompanied by the corresponding increase in your transect data, is a powerful combination.
- Collaborate and Validate: When you submit your data to a national scheme like the UKBMS, mention it and tag them. This provides powerful third-party validation of your work and amplifies your reach to a wider, engaged audience.
By sharing your data in this way, you are not just marketing; you are educating your audience and transparently substantiating your claims of ethical stewardship. You are inviting them to see the proof for themselves.
Key Takeaways
- Systematic monitoring transforms biodiversity from a concept into a verifiable farm asset.
- Targeted management of ‘weeds’ like nettles and ‘messy’ scrub are high-impact actions for specific indicator species.
- Standardised protocols (transects, TBI) are essential for generating credible, comparable data that has value beyond the farm gate.
How to leverage Ethical Stewardship to Command a Premium Price for UK Produce?
In a crowded marketplace, the verifiable story of your farm’s ecological health is your most powerful differentiator. Consumers and wholesale buyers are increasingly looking for products with a provably positive impact. The data you collect through systematic monitoring is the evidence that elevates your produce from a commodity to a premium product with a story of ethical stewardship that you can charge more for.
The wider context makes this local data even more valuable. In Europe, grassland butterflies are in a state of crisis. The stark reality is that official European Environment Agency data shows that an index of 17 key grassland butterfly species has declined by 50% since 1991. Against this backdrop of widespread decline, a demonstrable, farm-level trend of stable or increasing butterfly populations is an exceptionally powerful marketing tool. It proves your farm is an oasis of health in a struggling landscape.
This isn’t just about consumer perception; it’s about aligning with the future of agricultural policy and funding. New environmental schemes are increasingly data-led, rewarding farmers for proven outcomes, not just good intentions. Your butterfly transect data is precisely the kind of evidence these schemes are built on.
Case Study: Linking Monitoring to UK Environmental Land Management (ELM) Schemes
The direction of travel is clear. Both the EU Nature Restoration Regulation (2024) and the UK’s own Environmental Land Management (ELM) schemes are now explicitly incorporating metrics like the Grassland Butterfly Index as key performance indicators for farm ecosystems. Farms that can provide independently verified evidence of positive trends in these indicators, such as through data submitted to the UKBMS, are positioned to qualify for advanced, higher-tier payments. This robust monitoring data serves a dual purpose: it unlocks public funding and provides the hard evidence needed to justify premium pricing to buyers or to gain certification under high-bar labels like regenerative agriculture.
Ultimately, the time spent on a transect walk or analysing soil health is an investment. It generates a unique and valuable asset: the provable story of your land’s regeneration. This story allows you to command a premium, access higher-tier funding, and build a brand founded on the most solid ground possible: verifiable ecological integrity.
Start today by mapping out a transect route on your farm. The journey from observation to validation begins with that first, methodical walk. By consistently gathering and communicating your biodiversity data, you are investing in the long-term ecological and financial resilience of your farm.