To truly manage soil health, you must measure it. Moving beyond simple earthworm counts, a suite of quantifiable, field-based protocols allows any regenerative farmer to assess the real-time activity of their entire soil food web.
- Microbial decomposition can be reliably measured using the standardized Tea Bag Index, directly linking climate and activity.
- Mesofauna populations (like springtails) can be sampled and their abundance correlated with soil structure and nutrient cycling.
- Infiltration rates and bio-indicator plants provide powerful, visible proxies for the underground engineering work of your soil fauna.
Recommendation: Start by implementing one or two of these measurement protocols—like the Tea Bag Index and a puddle test—to establish a quantitative baseline of your soil’s biological engine.
As a regenerative farmer, you’re investing time, effort, and resources into practices designed to bring your soil back to life. You add compost, plant cover crops, and reduce tillage, all with the goal of fostering a thriving underground ecosystem. But how do you know if it’s working? Beyond the satisfaction of seeing more earthworms after a rain, it often feels like you’re operating on faith. The agricultural industry points towards expensive laboratory tests like PLFA or DNA sequencing, which provide a detailed snapshot but are often too costly and slow for regular feedback on management decisions. This leaves a critical gap: the need for reliable, low-cost, field-based methods to quantify the activity of your soil’s biological engine.
The common advice to « just count earthworms » is a good start, but it only tells a fraction of the story. Earthworms are the visible giants of the soil, but the real work of decomposition, nutrient cycling, and structure building is driven by a vast and diverse community of organisms, from microscopic bacteria and fungi to the bustling world of mesofauna—springtails, mites, and other tiny arthropods. Measuring the *activity* and *diversity* of this entire soil food web is the key to understanding if your soil is merely existing or truly thriving. The core issue isn’t a lack of life, but a lack of accessible measurement.
But what if the key wasn’t more expensive lab tests, but a smarter way of observing and quantifying what’s already happening in your fields? This guide is built on a single premise: you can become a soil ecologist on your own land. We will move beyond qualitative observations and into the realm of measurement-focused protocols. This article provides a toolkit of practical, scientifically-grounded methods that allow you to measure the work of your soil organisms. We will explore how to use simple tea bags to test microbial power, how to count the invisible world of mesofauna, and how to interpret the very structure of your soil as a direct report on its inhabitants’ activity.
This article is structured to provide a comprehensive toolkit for field-based soil life assessment. You will find detailed, actionable protocols to measure key aspects of your soil’s ecosystem, from microbial activity to the impact of the largest soil engineers.
Contents: A Farmer’s Guide to Quantifying Soil Life
- Why the ‘Tea Bag Index’ is a Reliable Test for Microbial Activity?
- How to Spot Mesofauna Activity with a Simple Hand Lens?
- Fungicides vs Herbicides: Which Depresses Fauna Activity More?
- The Temperature Mistake: Why You Shouldn’t Count Fauna in Winter?
- Feeding the Soil: How to Mulch to Explode Fauna Populations?
- Monitoring Earthworms: How to Count Populations to Track Recovery?
- How to Use Puddle Duration to Assess Infiltration Rates?
- How to Use Bio-Indicator Observation to Diagnose Soil Health Without Lab Tests?
Why the ‘Tea Bag Index’ is a Reliable Test for Microbial Activity?
To measure the work of your soil’s smallest inhabitants—the bacteria and fungi—you need a standardized, decomposable material. The Tea Bag Index (TBI) provides exactly that. This brilliantly simple method uses two types of tea bags, Rooibos and Green tea, which have different decomposition rates due to their chemical composition. By burying these bags and measuring their weight loss after a set period, you can calculate a decomposition rate (k) and a stabilization factor (S). This isn’t just a gimmick; it’s a globally recognized scientific tool that provides a direct measure of the total biological activity in your soil.
The power of the TBI lies in its standardization and sensitivity. It bypasses the complexity of identifying thousands of microbial species and instead measures their collective metabolic output. Research confirms its reliability; one study from long-term field experiments shows that climate conditions explained more than 70% of the variation in the tea bags’ decomposition and stabilization. This means the test is sensitive enough to reflect how your local conditions—and by extension, your management practices that alter soil moisture and temperature—are influencing your soil’s fundamental ability to cycle carbon.
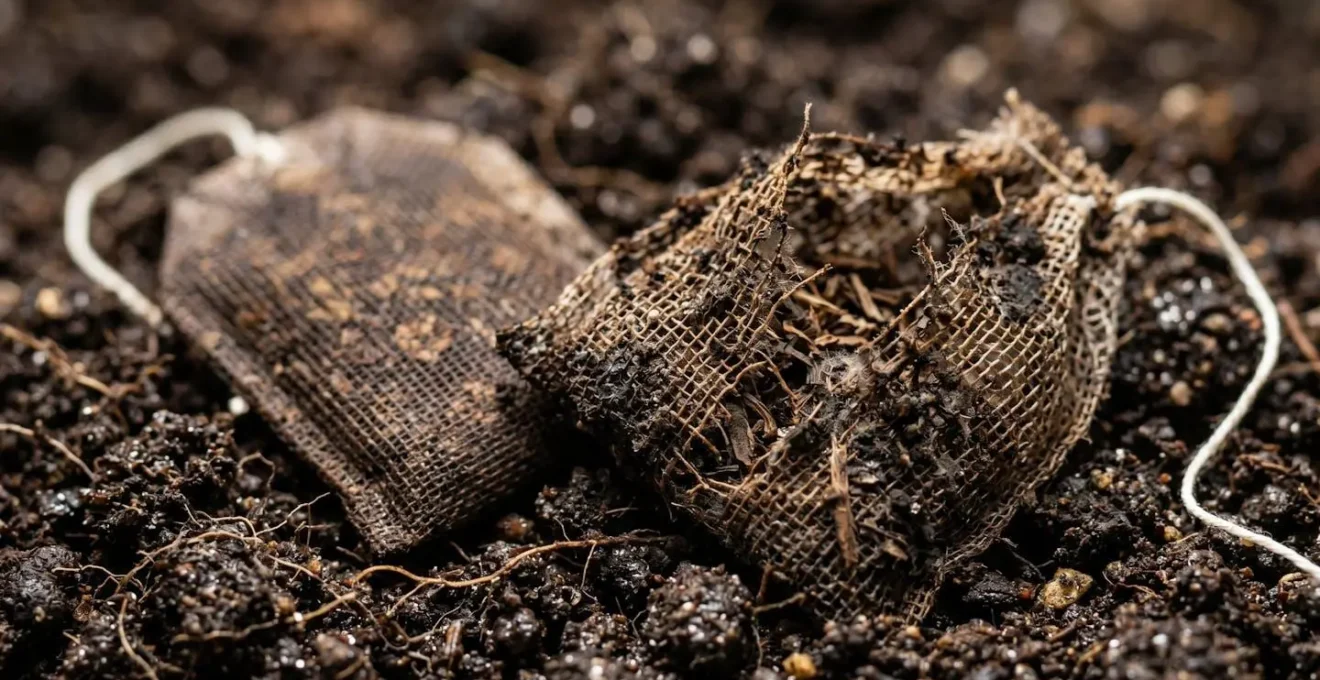
As the image above illustrates, the visual difference in decomposition can be stark. The more broken down the bag, the more active your microbial workforce. By weighing the bags before and after burial, you turn this visual observation into a hard number. This allows you to baseline your fields, compare different management zones (e.g., tilled vs. no-till, different cover crops), and track your progress in building a more biologically active soil system over time. It is the ultimate proxy for the speed of your soil’s « gut ».
How to Spot Mesofauna Activity with a Simple Hand Lens?
While microbes are the invisible engine, the next level up in the soil food web is the mesofauna: a bustling world of springtails (Collembola), mites, and other arthropods smaller than 2mm. These creatures are not pests; they are critical players in shredding organic matter, grazing on fungi and bacteria, and creating pore spaces. Observing them directly in the field is difficult, but their abundance can be quantified. A simple hand lens (10x magnification) is a good start for observing them on the surface of leaf litter or a shovelful of rich topsoil, but to get a true population count, you need to extract them.
The standard method for this is a Berlese-Tullgren funnel. This simple device uses a heat source (like a low-wattage bulb) to slowly dry a soil sample from the top. The mesofauna, seeking moisture, migrate downwards and fall through a funnel into a collection jar, typically containing alcohol. After a few days, you can examine the collected organisms. You don’t need to be an entomologist to get valuable data. The sheer number and diversity of creatures you collect is a powerful indicator. Are you collecting dozens, or thousands? Are there many different shapes and sizes, or just one or two dominant types?
The significance of these tiny creatures is hard to overstate. A comprehensive global analysis of springtail communities provides staggering context. The study, analyzing nearly 250,000 records, revealed that Collembola comprise an estimated 32% of all terrestrial arthropods on Earth. In healthy, moist soils, their numbers can be astronomical, ranging up to 250,000 individuals per square meter. Knowing this baseline helps you understand that if your Berlese funnel yields only a handful of organisms, your soil’s food web is severely depleted. Tracking these numbers over seasons and years provides a direct measure of your success in rebuilding this critical faunal layer.
Fungicides vs Herbicides: Which Depresses Fauna Activity More?
Regenerative practices aim to build soil life, but certain inputs can tear it down with alarming efficiency. Understanding the differential impact of pesticides is crucial for any farmer trying to balance crop protection with soil stewardship. While insecticides are known to be broadly toxic, the distinction between fungicides and herbicides is often less clear. Intuition might suggest fungicides are more harmful to the soil food web, which is heavily reliant on fungi. The data, however, paints a more nuanced and concerning picture for both.
A comprehensive hazard assessment reviewed 394 studies and found a bleak reality: pesticides negatively affected 70.5% of tested parameters for soil organisms. When broken down by type, the results are revealing. A comprehensive hazard assessment encompassing 275 soil species found that fungicides had a 71.4% negative impact rate, while herbicides were slightly lower at 63.2%. The mechanism of harm, however, is critically different. Fungicides often have a direct toxic effect, not just on pathogenic fungi but on the beneficial mycorrhizal and saprophytic fungi that form the base of the soil food web. This starves the fungal-feeding mesofauna, like oribatid mites.
Systemic herbicides, on the other hand, can be even more insidious. They work by killing plants, which indirectly starves the entire soil food web by cutting off its primary food source: root exudates and fresh plant litter. This « bottom-up » devastation can be more total and longer-lasting than the direct « top-down » toxicity of a fungicide. The choice is not between a « good » and « bad » pesticide, but between different pathways of ecosystem disruption. The table below details these differing impact mechanisms, highlighting that the most detrimental scenario is often the « cocktail » effect of multiple substances applied together.
| Pesticide Type | Primary Mechanism | Impact on Soil Fauna Communities | Persistence of Effect |
|---|---|---|---|
| Fungicides | Direct toxic effect on fungi + indirect effect on fungal-feeding mesofauna | 71.4% of tested parameters negatively affected; particularly impacts oribatid mites and fungal-dependent food webs | Functional impacts persist months beyond chemical half-life |
| Systemic Herbicides | Indirect effect via cutting root exudates + plant litter supply to soil food web | 63.2% negative effects; devastates entire detritus-based food chain from bottom up | Long-term microbial community shifts; AMF abundance significantly reduced |
| Contact Herbicides | Surface-level plant tissue damage with limited translocation | Lower overall soil food web impact compared to systemic herbicides | Shorter functional half-life; rhizosphere less affected |
| Multiple Substances (cocktail) | Synergistic interactions between chemicals at ‘safe’ individual doses | Most detrimental scenario; broad-spectrum impacts across all fauna groups | Unpredictable cumulative effects; often untested in regulatory frameworks |
The Temperature Mistake: Why You Shouldn’t Count Fauna in Winter?
Timing is everything in ecology. Attempting to measure soil life without considering the season is a fundamental error that can lead to wildly inaccurate conclusions. Soil organisms, from microbes to earthworms, are largely ectothermic, meaning their metabolic activity is dictated by the surrounding temperature. Counting fauna in the middle of a cold winter or a hot, dry summer is like assessing a factory’s productivity when the entire workforce is on holiday. You’ll find very little activity, not because the ecosystem is dead, but because it is dormant.
The most active period for soil life in temperate climates is during the spring rebound and the moist autumn months when temperatures are moderate and moisture is available. This is when you should conduct your monitoring. In fact, field experiment data demonstrates that tea bags buried during the growing season when soil biological activity is highest showed decomposition rates governed primarily by the climatic conditions during that active period. This highlights that measurements taken during dormant periods are not representative of the soil’s true potential.
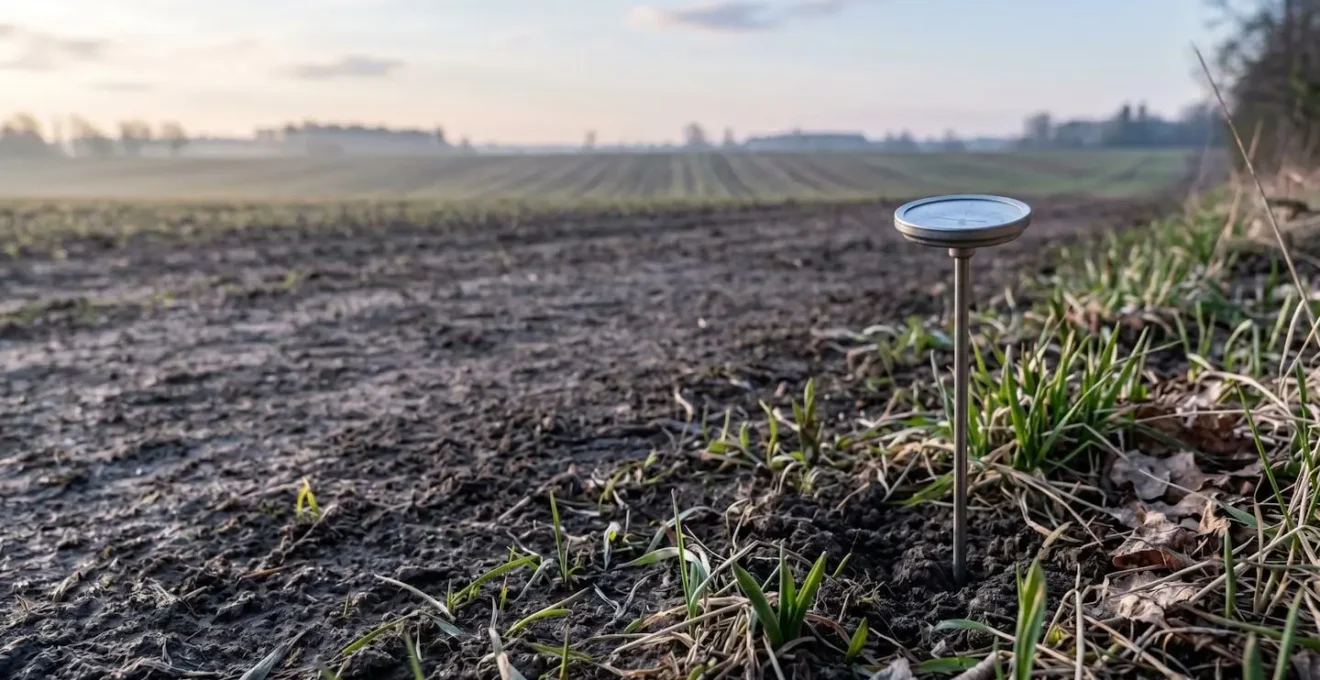
To move from guessing to measuring, a simple soil thermometer is an invaluable tool. By monitoring soil temperature at a consistent depth (e.g., 10cm), you can make informed decisions about when to sample. A more advanced method is tracking accumulated degree-days. This involves summing the daily average temperatures above a certain baseline (typically 5°C or 41°F for soil fauna). When you reach a certain threshold of accumulated heat in the spring, it’s the biological green light that your soil engine is warming up. This quantitative approach allows for year-to-year comparisons, accounting for early or late springs and ensuring you are always measuring your soil life at its peak operational capacity.
Feeding the Soil: How to Mulch to Explode Fauna Populations?
If you want to boost your soil fauna, you have to feed them. Mulching is the single most powerful way to provide the food and habitat that these organisms need to thrive. However, not all mulch is created equal. Different materials, with varying Carbon-to-Nitrogen (C:N) ratios and particle sizes, will selectively feed different parts of the soil food web. Thinking of mulch not as a generic « covering » but as a targeted « menu » is a strategic shift for the regenerative farmer.
A high-C:N mulch, like coarse wood chips or bark, decomposes slowly and is a feast for fungal-dominated networks. These materials build stable soil structure and favor fungal-feeding mites and larger arthropods. In contrast, a low-C:N « green » mulch, like fresh grass clippings or clover, is rapidly consumed by bacterial-dominated communities. This provides a quick release of nutrients and is a buffet for earthworms and bacterial-feeding nematodes. The table below outlines how different mulch types can be used to engineer your soil food web.
| Mulch Type | C:N Ratio | Primary Decomposers Favored | Soil Engineering Effect | Fauna Groups Boosted |
|---|---|---|---|---|
| Ramial Chipped Wood (RCW) – young branches <7cm | High (>50:1) | Fungal-dominated networks | Creates stable soil aggregates; promotes mycorrhizal associations | Fungal-feeding mites (Oribatida); predatory mesostigmatid mites; wood-dwelling enchytraeids |
| Coarse woody mulch (chips, bark) | Very High (80-120:1) | Slow-acting fungi and specialized decomposers | High porosity; excellent aeration; long-lasting structure | Springtails (elongated forms); larger arthropods; surface-dwelling fauna |
| Green/soft mulch (clover, grass clippings) | Low (15-25:1) | Bacterial-dominated; rapid cycling | Fast nutrient release; creates biopores through earthworm activity | Earthworms (epigeic and endogeic); bacterial-feeding nematodes; enchytraeids |
| Straw (cereal residues) | Medium (40-80:1) | Mixed bacterial-fungal | Moderate structure; seasonal decomposition pulse | Diverse mesofauna; particularly springtails (up to 250,000/m² in moist conditions) |
| Layered ‘Soil Food Buffet’ (mixed brown+green) | Balanced (25-40:1 overall) | Complete food web from bacteria to fungi | Simultaneous aggregate formation and nutrient cycling | Maximum diversity: all ecological groups co-exist with functional redundancy |
Case Study: The ‘Too Much of a Good Thing’ Problem
While mulch is beneficial, application technique matters. FAO field studies offer a critical warning: applying fine-particle mulches too thickly (>10cm) can create a suffocating, anaerobic mat that actually depresses soil fauna activity. The studies established optimal guidelines: coarse woody mulches should be applied at a 5-10cm maximum depth, while finer materials should not exceed 3-5cm. The results of proper application were dramatic, with one study finding that earthworm populations increased by up to 80% under appropriately applied coarse mulch compared to bare soil, demonstrating the powerful link between providing the right food and habitat.
Monitoring Earthworms: How to Count Populations to Track Recovery?
Earthworms are the most recognizable bio-indicators of a healthy soil. Their presence indicates sufficient moisture, food, and a lack of toxic conditions. Tracking their populations over time is one of the most rewarding ways to see your regenerative efforts pay off. But to move from anecdotal observation (« I’m seeing more worms! ») to quantitative data, you need a standardized sampling method. Simple hand-sorting of a shovelful of soil is a start, but it’s prone to variability and often misses deeper-dwelling species.
The scientific standard for sampling earthworms without major excavation is the mustard extraction method. This protocol involves pouring a solution of ground mustard and water onto a defined area of soil. The mustard irritates the worms’ skin, causing them to come to the surface where they can be collected, counted, and identified. This method is significantly more effective and less destructive than digging. The validity of this approach is backed by research; controlled mesocosm experiments demonstrated that mustard extraction accurately detected anecic earthworm occupancy 92% of the time when used correctly, a vast improvement over visual searches alone.
For a regenerative farmer, the real value comes from not just counting, but classifying. Earthworms are not a monolithic group; they fall into three main ecological categories, or functional groups:
- Epigeic: Small, surface-dwelling worms that live in the leaf litter (e.g., Red Wigglers). They are important for shredding organic matter.
- Endogeic: Pale, topsoil-dwelling worms that create horizontal burrows. They mix soil and organic matter within the topsoil layer.
- Anecic: Large, deep-burrowing worms (e.g., Nightcrawlers) that create permanent vertical burrows. They are powerful soil engineers, dramatically improving water infiltration and aeration.
The return of anecic species to a field is a major milestone in soil regeneration. By sorting the worms collected during your mustard extraction, you can track the recovery not just of worm numbers, but of entire ecosystem functions.
How to Use Puddle Duration to Assess Infiltration Rates?
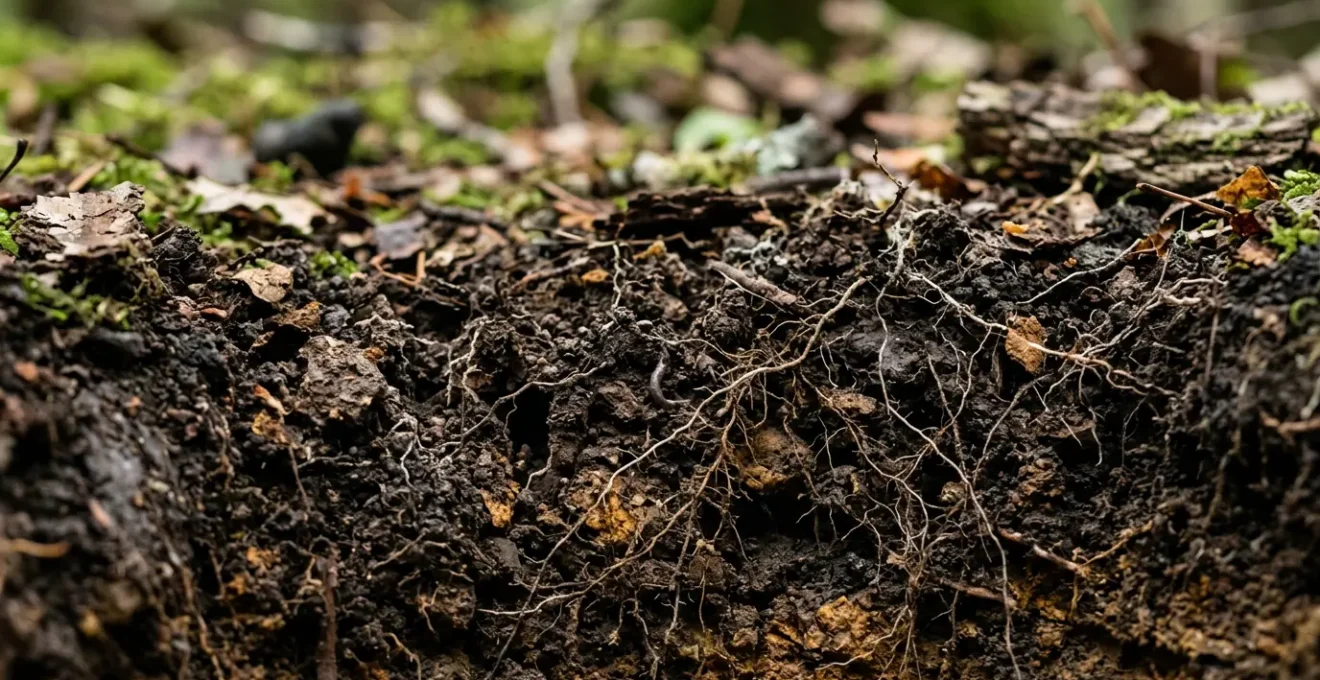
One of the most critical services provided by a healthy soil ecosystem is water management. A soil teeming with life, full of biopores from roots and worm burrows, acts like a sponge, absorbing rainfall and reducing runoff and erosion. A compacted, lifeless soil, in contrast, acts like concrete. The simplest way to measure this function is to observe how long it takes for a puddle to disappear. But to make this observation a repeatable, quantitative test, you need a standardized protocol: the infiltration ring test.
This test isolates a small area of soil and measures the time it takes for a specific volume of water to infiltrate. It requires minimal equipment—a metal ring (a section of 30cm PVC pipe works well), a one-liter container, and a stopwatch. By repeating this test in the same locations year after year, you can build a clear, data-driven picture of how your management practices are improving your soil’s hydrological function. Is your infiltration time dropping from 30 minutes to 5 minutes? That’s a direct, measurable result of your soil fauna’s engineering work.
This improvement is not magic; it’s biology. In particular, soil ecosystem engineering studies show that anecic earthworms create deep, stable, vertical burrows that act as superhighways for water to move into the soil profile. The presence of these « macropores » can increase infiltration rates by orders of magnitude. So, when you see your infiltration time decrease, you are directly measuring the positive impact of restoring these crucial soil engineers. The puddle test becomes a proxy for your anecic earthworm population.
Your Action Plan: Standardized Infiltration Ring Test
- Equipment: Gather a 30cm diameter ring (e.g., PVC pipe section), 1-liter measuring container, and a stopwatch.
- Installation: Select representative zones in your field. Press the ring 2-3cm into the soil surface to create a good seal.
- Procedure: Pour exactly 1 liter of water into the ring at a steady rate and start the timer immediately.
- Measurement: Stop the timer when all standing water has disappeared. Record the time. A time of <5 min is excellent; 5-15 min is good; 15-60 min is poor; >60 min indicates severe compaction.
- Analysis: After infiltration, observe the soil surface. Intact aggregates are a sign of good structure; a muddy crust (slaking) indicates poor stability. Use this data to diagnose compaction issues.
Key takeaways
- True soil health management requires moving beyond qualitative observation to quantitative, field-based measurement.
- Standardized protocols like the Tea Bag Index (for microbes), Berlese funnels (for mesofauna), and mustard extraction (for earthworms) provide reliable, low-cost data.
- Observing functional outcomes, such as water infiltration rates and the succession of bio-indicator plants, offers a powerful, system-level diagnosis of soil health recovery.
How to Use Bio-Indicator Observation to Diagnose Soil Health Without Lab Tests?
Your fields are constantly communicating their condition. The plants that grow—or fail to grow—are not random; they are direct indicators of the underlying soil environment. Learning to read these signals is a skill that turns the entire farm into a diagnostic dashboard, often revealing issues of compaction, nutrient imbalance, or poor biological activity long before they show up in a lab test.
Certain « weeds » are specialists, thriving in conditions where more desirable crops struggle. The deep taproot of a dandelion or plantain, for example, is a classic sign of a compacted soil layer that other roots cannot penetrate. The presence of birds following your plough or tiller is a direct, if fleeting, measure of your macrofauna biomass—they are there for the abundant feast of earthworms and grubs you’ve just exposed. The table below provides a starting point for translating these common observations into a soil health diagnosis.
| Bio-Indicator Plant/Organism | Soil Condition Indicated | Underlying Problem | Fauna Correlation |
|---|---|---|---|
| Dandelion (Taraxacum) | Compacted soil layers | Heavy machinery traffic; reduced pore space | Low earthworm activity; reduced mesofauna in compacted zones |
| Plantain (Plantago) | Hard, compacted surface | Foot/vehicle traffic; crusting | Mesofauna confined to deeper layers; poor surface colonization |
| Creeping Thistle (Cirsium arvense) | Deep compaction with high nitrogen | Plough pan formation; nutrient stratification | Anecic earthworms absent; endogeic species may persist |
| Ground beetles (Carabidae) abundance | Good surface habitat structure | Adequate organic matter and refuge sites | High predation on pests; indicates healthy surface food web |
| Birds following plough | Abundant soil macrofauna | Healthy earthworm and grub populations being exposed | Direct indicator of macrofauna biomass (earthworms, beetle larvae) |
| J-rooting in taproots | Hardpan layer at depth | Physical barrier preventing root penetration | Reduced deep-burrowing fauna; limited vertical galleries |
Case Study: Reading Ecological Succession
The ultimate bio-indicator is ecological succession. Long-term monitoring of regenerating soils shows a clear pattern: a shift from annual, opportunistic weeds (like pigweed) to deep-rooted perennials (like chicory or dock) is a powerful sign of improving soil structure and fertility. This plant community shift is tightly correlated with the recovery of the soil food web. For example, as perennial vegetation establishes, springtail populations can increase from initial colonization levels of 10,000/m² to mature ecosystem levels of over 100,000/m², indicating a complete restoration of food web complexity and the valuable ecosystem services they provide.
By integrating these measurement-focused protocols into your management, you shift from being a farmer who works the soil to a soil ecologist who partners with it. Start today by choosing one or two of these methods to establish your baseline, and begin the rewarding process of quantifying the regeneration of life beneath your feet.